Elementary-Level English:
Fewer Students Show Serious Academic Problems
In the Big 5 Cities and in the Urban-Suburban Districts, substantially smaller numbers of students scored at Level 1 in 2005 than in 1999.
Chart Image: Percentage of Students Scoring at Level 1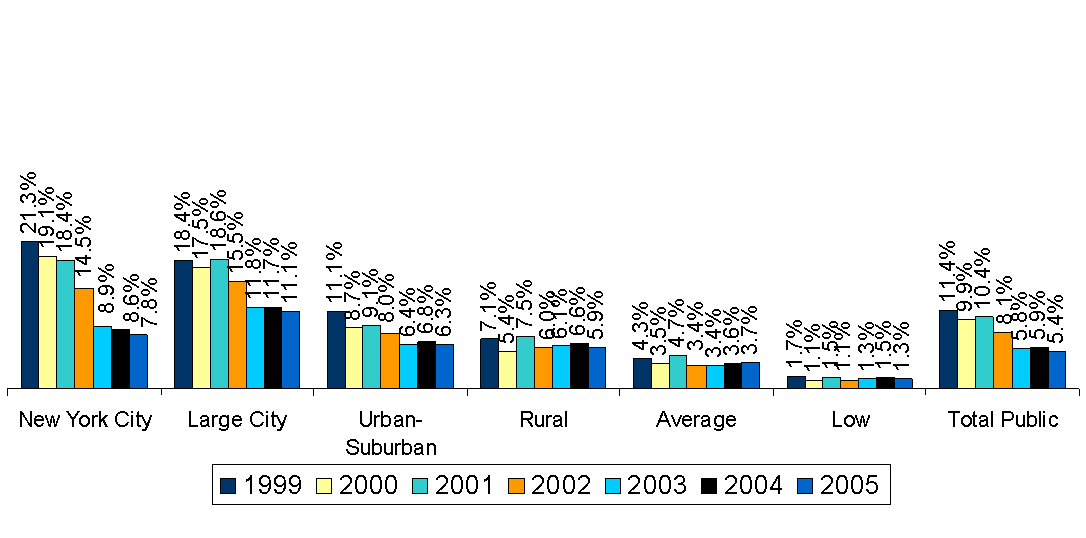
| New York City | Large City | Urban-Suburban | Rural | Average | Low | Total Public | |
|---|---|---|---|---|---|---|---|
| 1999 | 0.213 | 0.184 | 0.111 | 0.071 | 0.043 | 0.017 | 0.114 |
| 2000 | 0.191 | 0.175 | 0.087 | 0.054 | 0.035 | 0.011 | 0.099 |
| 2001 | 0.184 | 0.186 | 0.091 | 0.075 | 0.047 | 0.015 | 0.104 |
| 2002 | 0.145 | 0.155 | 0.08 | 0.06 | 0.034 | 0.011 | 0.081 |
| 2003 | 0.089 | 0.118 | 0.064 | 0.061 | 0.034 | 0.013 | 0.058 |
| 2004 | 0.086 | 0.117 | 0.068 | 0.066 | 0.036 | 0.015 | 0.059 |
| 2005 | 0.078 | 0.111 | 0.063 | 0.059 | 0.037 | 0.013 | 0.054 |
All Students
Public Schools Only
Percentage of Students Scoring at Level 1