Elementary-Level English:
In both income groups, the percentage of students meeting the standards increased in 2005.
Percent of Students Scoring at Levels 3 and 4
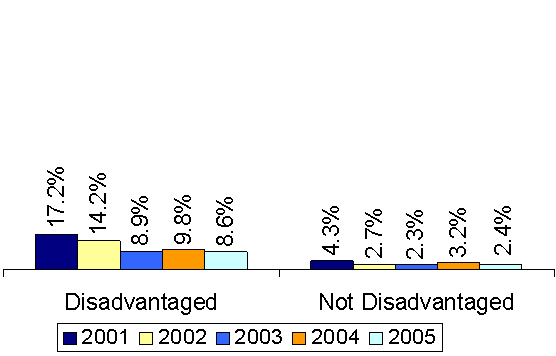
Percent of Students Scoring at Level 1
2005 Count of Tested Elementary-Level ELA Students:
Disadvantaged: 93,838
Not Disadvantaged: 102,004
Chart Image: Percent of Students Scoring at Levels 3 & 4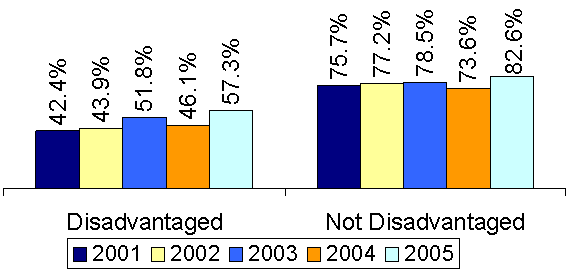
| Disadvantaged | Not Disadvantaged | |
|---|---|---|
| 2001 | 0.424 | 0.757 |
| 2002 | 0.439 | 0.772 |
| 2003 | 0.518 | 0.785 |
| 2004 | 0.461 | 0.736 |
| 2005 | 0.573 | 0.826 |
| Disadvantaged | Not Disadvantaged | |
|---|---|---|
| 2001 | 0.172 | 0.043 |
| 2002 | 0.142 | 0.027 |
| 2003 | 0.089 | 0.023 |
| 2004 | 0.098 | 0.032 |
| 2005 | 0.086 | 0.024 |
All Students
Public Schools Only