Elementary-Level Mathematics
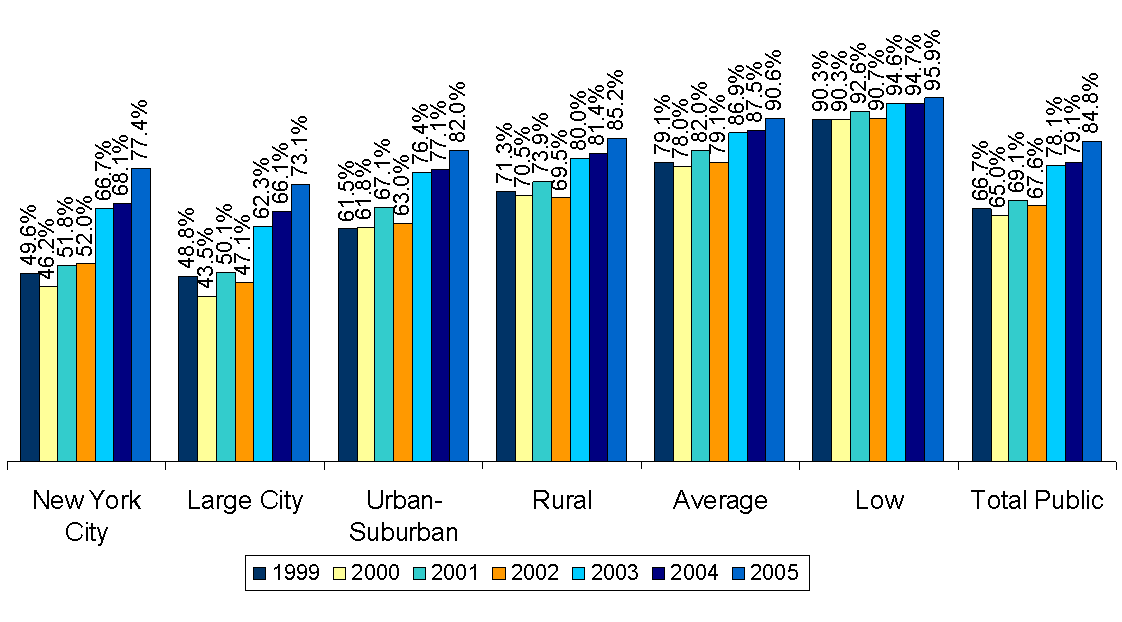
The percentage of students achieving all the standards increased in every need/resource capacity category. Since 1999, New York City and the Big Four have achieved increases of about 25 percentage points.
| New York City | Large City | Urban-Suburban | Rural | Average | Low | Total Public | |
|---|---|---|---|---|---|---|---|
| 1999 | 0.496 | 0.488 | 0.615 | 0.713 | 0.791 | 0.903 | 0.667 |
| 2000 | 0.462 | 0.435 | 0.618 | 0.705 | 0.78 | 0.903 | 0.65 |
| 2001 | 0.518 | 0.501 | 0.671 | 0.739 | 0.82 | 0.926 | 0.691 |
| 2002 | 0.52 | 0.471 | 0.63 | 0.695 | 0.791 | 0.907 | 0.676 |
| 2003 | 0.667 | 0.623 | 0.764 | 0.8 | 0.869 | 0.946 | 0.781 |
| 2004 | 0.681 | 0.661 | 0.771 | 0.814 | 0.875 | 0.947 | 0.791 |
| 2005 | 0.774 | 0.731 | 0.82 | 0.852 | 0.906 | 0.959 | 0.848 |
Percentage of Students Scoring at Levels 3 and 4