Elementary-Level Mathematics
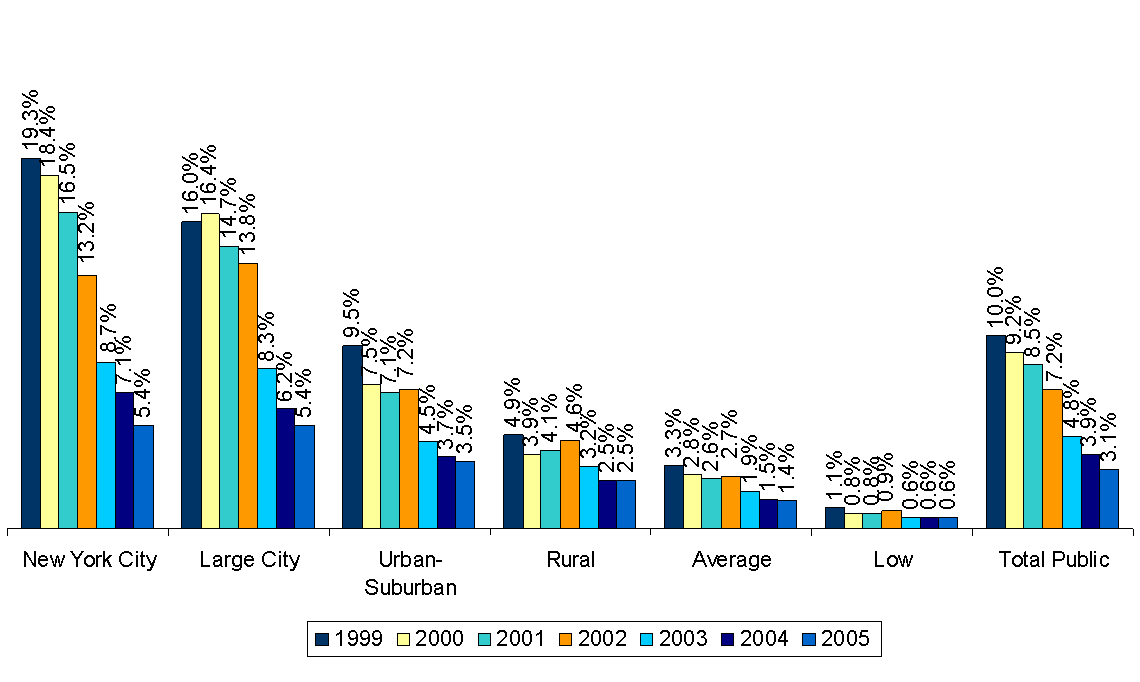
The percentage of students with serious academic problems has declined. The biggest declines have been in the Big Five.
| New York City | Large City | Urban-Suburban | Rural | Average | Low | Total Public | |
|---|---|---|---|---|---|---|---|
| 1999 | 0.193 | 0.16 | 0.095 | 0.049 | 0.033 | 0.011 | 0.1 |
| 2000 | 0.184 | 0.164 | 0.075 | 0.039 | 0.028 | 0.008 | 0.092 |
| 2001 | 0.165 | 0.147 | 0.071 | 0.041 | 0.026 | 0.008 | 0.085 |
| 2002 | 0.132 | 0.138 | 0.072 | 0.046 | 0.027 | 0.009 | 0.072 |
| 2003 | 0.087 | 0.083 | 0.045 | 0.032 | 0.019 | 0.006 | 0.048 |
| 2004 | 0.071 | 0.062 | 0.037 | 0.025 | 0.015 | 0.006 | 0.039 |
| 2005 | 0.054 | 0.054 | 0.035 | 0.025 | 0.014 | 0.006 | 0.031 |
Percentage of Students Scoring at Level 1
Public Schools Only
All Students