Elementary-Level Mathematics
Comparing 2005 with 2001, more disadvantaged students are meeting the standards and fewer are scoring at Level 1.
Percent of Students Scoring at Levels 3 and 4
Percent of Students Scoring at Level 1
2005 Count of Tested Elementary-Level Mathematics Students:
Disadvantaged: 103,648
Not Disadvantaged: 103,568
Chart Image: Percentage of Students Scoring at Levels 3 & 4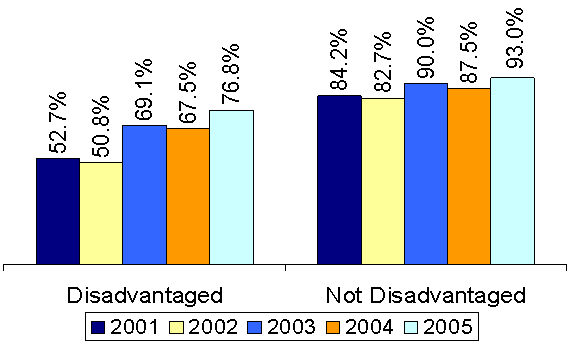
| Disadvantaged | Not Disadvantaged | |
|---|---|---|
| 2001 | 0.527 | 0.842 |
| 2002 | 0.508 | 0.827 |
| 2003 | 0.691 | 0.9 |
| 2004 | 0.675 | 0.875 |
| 2005 | 0.768 | 0.93 |
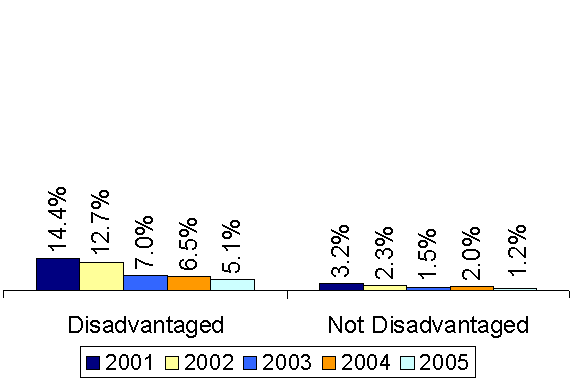
| Disadvantaged | Not Disadvantaged | |
|---|---|---|
| 2001 | 0.144 | 0.032 |
| 2002 | 0.127 | 0.023 |
| 2003 | 0.07 | 0.015 |
| 2004 | 0.065 | 0.02 |
| 2005 | 0.051 | 0.012 |
All Students
Public Schools Only