Middle-Level Mathematics
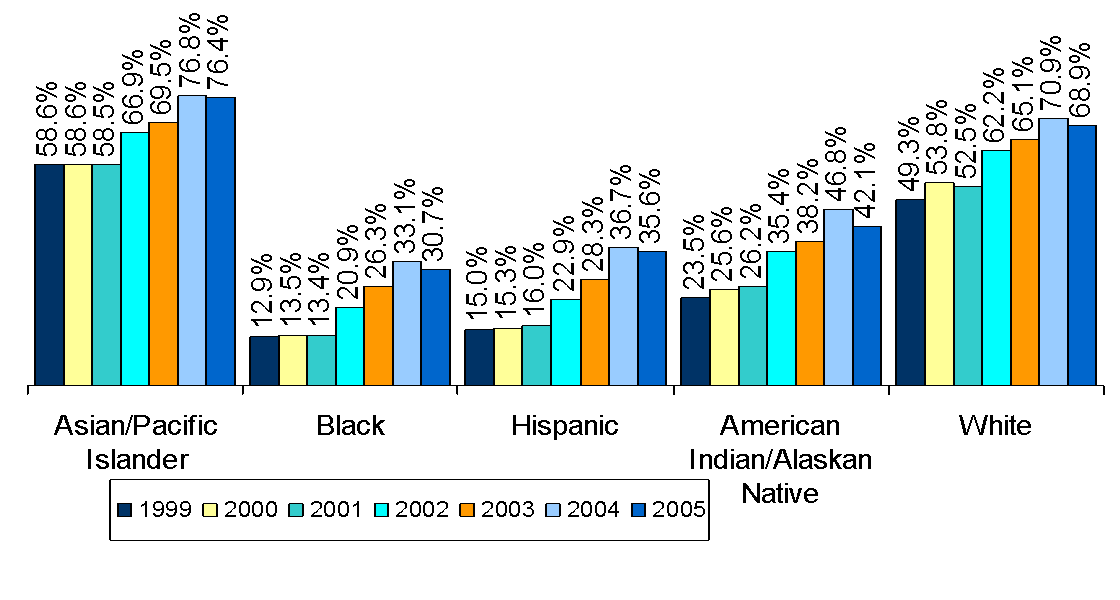
The percentage of students meeting all the standards declined in each racial/ethnic group in 2005. However, it increased overall between 1999 and 2004. Despite the decrease in 2005, Black and Hispanic students were more than twice as likely to meet the standards in 2005 as in 1999. However, their performance is still too low.
| Asian/Pacific Islander | Black | Hispanic | American Indian/Alaskan Native | White | |
|---|---|---|---|---|---|
| 1999 | 0.586 | 0.129 | 0.15 | 0.235 | 0.493 |
| 2000 | 0.586 | 0.135 | 0.153 | 0.256 | 0.538 |
| 2001 | 0.585 | 0.134 | 0.16 | 0.262 | 0.525 |
| 2002 | 0.669 | 0.209 | 0.229 | 0.354 | 0.622 |
| 2003 | 0.695 | 0.263 | 0.283 | 0.382 | 0.651 |
| 2004 | 0.768 | 0.331 | 0.367 | 0.468 | 0.709 |
| 2005 | 0.764 | 0.307 | 0.356 | 0.421 | 0.689 |
Percentage of Students Scoring at Levels 3 and 4