| Asian/Pacific Islander | Black | Hispanic | American Indian/Alaskan Native | White | |
|---|---|---|---|---|---|
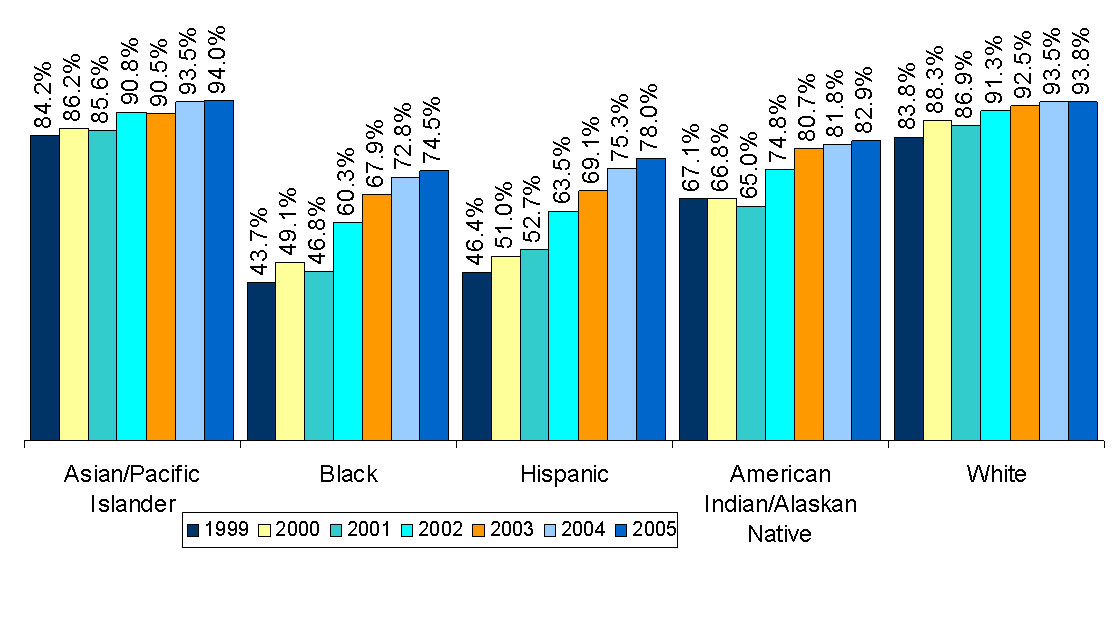
| 1999 | 0.842 | 0.437 | 0.464 | 0.671 | 0.838 |
| 2000 | 0.862 | 0.491 | 0.51 | 0.668 | 0.883 |
| 2001 | 0.856 | 0.468 | 0.527 | 0.65 | 0.869 |
| 2002 | 0.908 | 0.603 | 0.635 | 0.748 | 0.913 |
| 2003 | 0.905 | 0.679 | 0.691 | 0.807 | 0.925 |
| 2004 | 0.935 | 0.728 | 0.753 | 0.818 | 0.935 |
| 2005 | 0.94 | 0.745 | 0.78 | 0.829 | 0.938 |
Middle-Level Mathematics
The percentage of Black and Hispanic students scoring at Level 2 or above increased by over 30 percentage points between 1999 and 2005.
Percentage of Students Scoring at Levels 2, 3, and 4
Public Schools Only
All Students