Middle-Level English
More Black and Hispanic students scored at Level 2 or higher in 2005 than in any previous year.
Public Schools Only
Chart Image: Percentage of Students Scoring at Levels 2, 3 & 4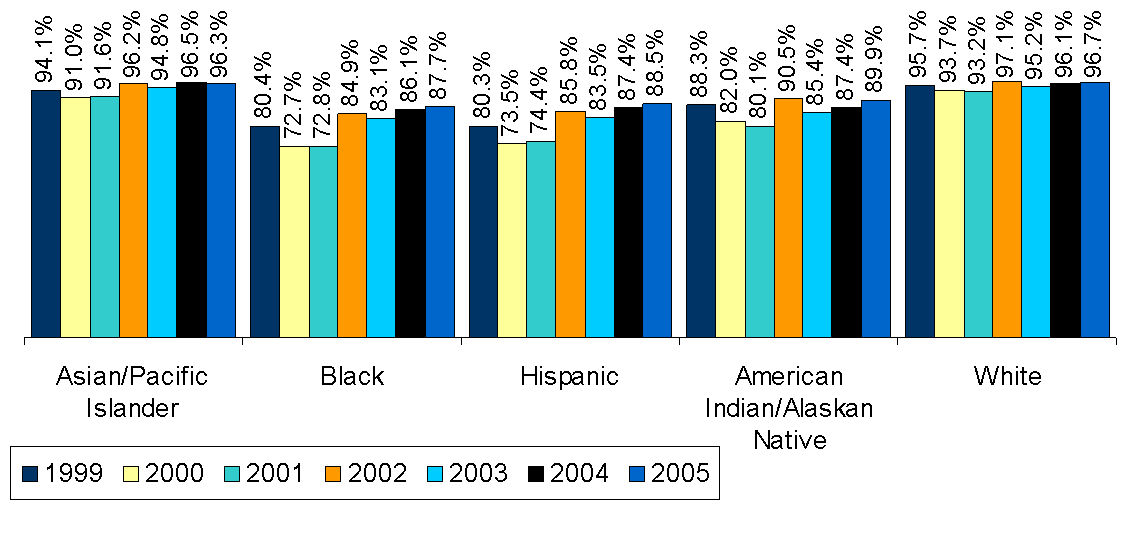
| Asian/Pacific Islander | Black | Hispanic | American Indian/Alaskan Native | White | |
|---|---|---|---|---|---|
| 1999 | 0.941 | 0.804 | 0.803 | 0.883 | 0.957 |
| 2000 | 0.91 | 0.727 | 0.735 | 0.82 | 0.937 |
| 2001 | 0.916 | 0.728 | 0.744 | 0.801 | 0.932 |
| 2002 | 0.962 | 0.849 | 0.858 | 0.905 | 0.971 |
| 2003 | 0.948 | 0.831 | 0.835 | 0.854 | 0.952 |
| 2004 | 0.965 | 0.861 | 0.874 | 0.874 | 0.961 |
| 2005 | 0.963 | 0.877 | 0.885 | 0.899 | 0.967 |
Percentage of Students Scoring at Levels 2, 3, and 4
All Students