Middle-Level Mathematics
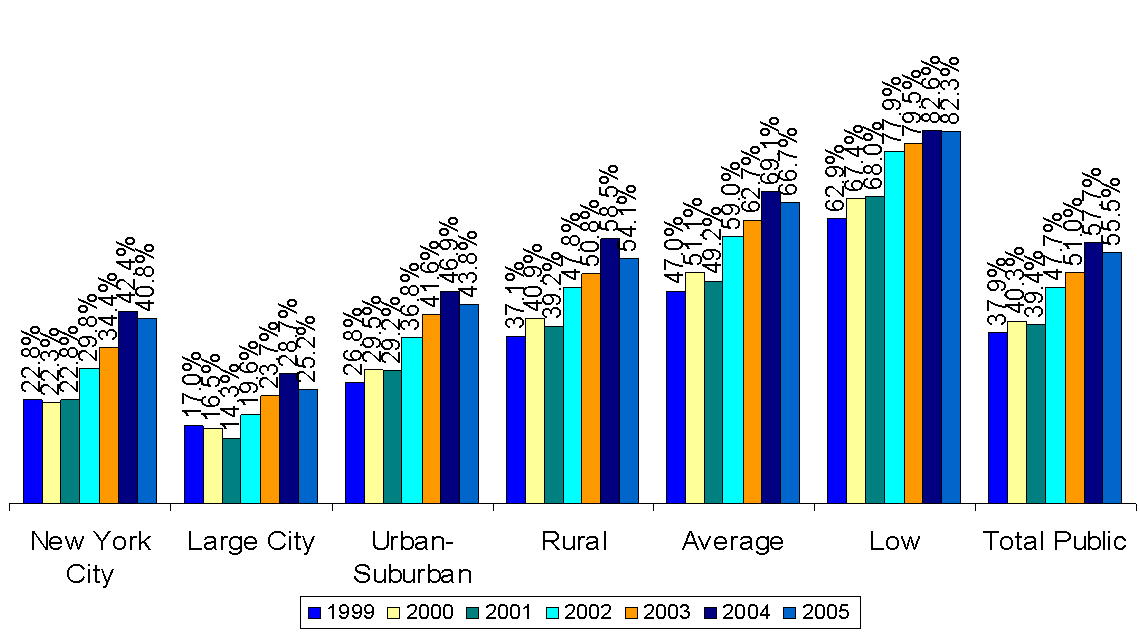
Despite a decline in 2005, more students overall are achieving all the standards now than in 1999.
| New York City | Large City | Urban-Suburban | Rural | Average | Low | Total Public | |
|---|---|---|---|---|---|---|---|
| 1999 | 0.228 | 0.17 | 0.268 | 0.371 | 0.47 | 0.629 | 0.379 |
| 2000 | 0.223 | 0.165 | 0.295 | 0.409 | 0.511 | 0.674 | 0.403 |
| 2001 | 0.228 | 0.143 | 0.292 | 0.392 | 0.492 | 0.68 | 0.394 |
| 2002 | 0.298 | 0.196 | 0.368 | 0.478 | 0.59 | 0.779 | 0.477 |
| 2003 | 0.344 | 0.237 | 0.416 | 0.508 | 0.627 | 0.795 | 0.51 |
| 2004 | 0.424 | 0.287 | 0.469 | 0.585 | 0.691 | 0.826 | 0.577 |
| 2005 | 0.408 | 0.252 | 0.438 | 0.541 | 0.667 | 0.823 | 0.555 |
Percentage of Students Scoring at Levels 3 and 4
All Students
Public Schools Only