Elementary-Level Mathematics:
Achievement Gap is Closing
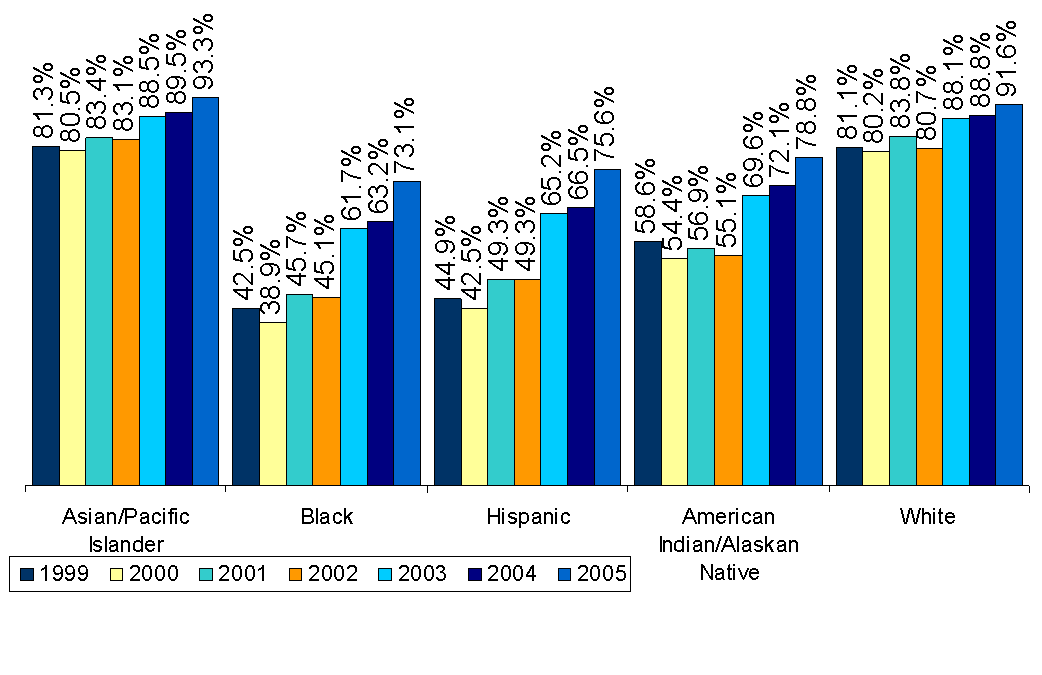
The percentage of Black and Hispanic students meeting all the standards improved significantly this year. The percent doing so has increased by over 30 percentage points since 1999.
| Asian/Pacific Islander | Black | Hispanic | American Indian/Alaskan Native | White | |
|---|---|---|---|---|---|
| 1999 | 0.813 | 0.425 | 0.449 | 0.586 | 0.811 |
| 2000 | 0.805 | 0.389 | 0.425 | 0.544 | 0.802 |
| 2001 | 0.834 | 0.457 | 0.493 | 0.569 | 0.838 |
| 2002 | 0.831 | 0.451 | 0.493 | 0.551 | 0.807 |
| 2003 | 0.885 | 0.617 | 0.652 | 0.696 | 0.881 |
| 2004 | 0.895 | 0.632 | 0.665 | 0.721 | 0.888 |
| 2005 | 0.933 | 0.731 | 0.756 | 0.788 | 0.916 |
Percentage of Students Scoring at Levels 3 and 4